In this blog post I would like to share my experience with using go-carbon to get better performance out of our monitoring system.
Monitoring is something we take very seriously at work. We monitor a lot of our critical services constantly in order to be able to detect degradation in performance immediately and act on it accordingly. We do this for APIs, applications and we also monitor the quality of the data that we collect. We use various tools, some of which include the following:
- ElasticSearch, logstash and Kibana (ELK) – used mainly for log analysis.
- Grafana, graphite, prometheus – real time API and service performance monitoring.
- Different paid services that provide application monitoring.
- Custom built monitoring – various monitoring tools and services built in-house that serve more bespoke needs.
- Other services.
Here I will focus on our Grafana setup and specifically the performance of carbon.
The Setup
Our setup runs on a single i3.2xlarge instance on AWS with the following specifications:
- 8 vCPUs
- 61 GB RAM
- 1900 GB NVMe SSD
The monitoring system is deployed using Docker and docker-compose and runs the following services in their own containers:
- Nginx
- Grafana
- Grafana Image Renderer – used to render images for Grafana alerts
- Graphite – this container runs the graphite UI, carbon, statsd and other related services
- Prometheus
Most of the services are deployed using very little customization – mostly config files setup with endpoints adjusted with the service names so that they can successfully communicate through the Docker network. All of the base images can be found on DockerHub and then we either extend the image with some config files or simply mount a volume with the adjusted configuration files. For the sake of keeping things short, I will not add the setup details in here, but setup should be easily achievable by reading the documentation of each base image.
Service Performance
The above setup has been performing quite well for quite a long time. We’ve been sending around 400,000 metrics a minute and were still able to have good performance reading and visualizing our data in multiple Grafana dashboards.
With the growth of the business, the amount of metrics started growing as well. At some point carbon started struggling with 500,000 metrics per minute and our dashboards became very slow and almost unusable. We started losing some metrics and I started looking at and experimenting with various ways that we can try and improve performance. I found this article by someone at Walmart Labs. I would highly recommend anyone to read it as it’s very well and clearly written and it will help understand how Graphite works and what can be done to improve performance.
What we saw in our Carbon monitoring was that the memory usage on that machine kept slowly growing until things got quite slow. Then I realized it was due to carbon not being able to persist metrics fast enough and it was keeping them in an in-memory queue.
Replacing Carbon with Go-Carbon
After reading the Walmart Labs article I started experimenting with various configuration settings for carbon. Unfortunately this didn’t help much, so then I decided to evaluate the performance of go-carbon, which was also mentioned as a potential candidate for them to evaluate: https://github.com/go-graphite/go-carbon.
My initial idea was to add another separate container running go-carbon and modify our docker-compose file and mappings to send our metrics there. I actually started writing my custom Dockerfile. Then I was checking how to set something up in Docker when I looked at the documentation of the following image: https://hub.docker.com/r/graphiteapp/graphite-statsd/. This is the exact same image that we run our graphite on and turns out it already comes with experimental go-carbon support. You can switch it on by setting the following environment variable: GOCARBON=1. I thought – Perfect! I can try it out quickly and it’s already been done for me.
Luckily everything worked just fine and I only needed to modify a few configuration values and modify the Carbon metrics to be able to monitor them the same way as we did before.
The Result
I would only say that I was very pleased with the result. At the moment the same instance seems to be always using around 4GB of the available RAM with occasional CPU spikes when flushing metrics down to disk. The following screenshot shows the current performance:
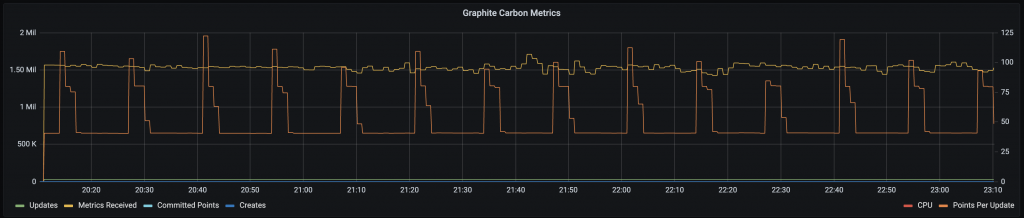
As you can see, now we’re at 1,500,000 metrics per minute. Additionally to this, the dashboards that were slow with carbon are now much faster and back to being usable due to the fact that we don’t hammer our RAM and CPU anymore.
Conclusion
I hope this has been a useful read for someone out there. My experience with go-carbon has been great and their claims seem to be true. I didn’t need to do much reconfiguration and the switch was almost a drop-in replacement and very seamless.
The approach at Walmart Labs seems to be allowing them to receive 6,000,000 metrics every minute which sounds great. This means that the techniques they’ve used (carbon relay, multiple carbon caches, HAProxy) work nicely. I was after something simpler and quicker and it worked well for me. If the amount of metrics we collect keeps growing, I will be definitely looking into adding this on top of go-carbon to further improve the usability and scalability of our monitoring system.